
 Facebook
 X
X
 Pinterest
 Copy Link
 Market Signals
| Month | Total Sales | # of Price Cuts | % of Price Cuts |
| JAN | 562 | 230 | 40.93% |
| FEB | 477 | 165 | 34.59% |
| MAR | 537 | 155 | 28.86% |
| APR | 372 | 100 | 26.88% |
West Hartford Property Taxes: What the Mill Rate Hike Means for You

West Hartford homeowners will see an increase in their property taxes in the upcoming fiscal year (July 1, 2025 - June 30, 2026) due to the adoption of a higher mill rate. The West Hartford Town Council approved a budget that sets the mill rate for real and personal property at 44.78 mills, a 5.74% increase from the current rate of 42.35 mills. This decision, made on April 22, 2025, will directly impact the amount of property taxes paid by homeowners in the town.
What is a Mill Rate?
A mill rate represents the amount of property tax for every $1,000 of assessed property value. The new mill rate of 44.78 mills means that for every $1,000 of your home's assessed value, you will pay $44.78 in property taxes.


Understanding Assessed Value
In Connecticut, property taxes are calculated using the assessed value, which is 70% of the fair market value determined during the town's most recent revaluation. West Hartford conducts a revaluation of all real estate every five years, as mandated by Connecticut State Statutes. The next revaluation is scheduled for October 1, 2026. The assessed value remains constant until the next revaluation, even if the actual market value of a property changes in the interim.
Calculating Your Property Tax:
- Determine your home's assessed value (70% of the value from the last revaluation).
- Multiply the assessed value by the mill rate (44.78 for 2025-2026).
- Divide by 1,000: The result is your estimated annual property tax bill.

Example (Illustrative - Using a hypothetical assessed value):
Let's say your home's assessed value is $350,000 (based on the last revaluation)
Tax Calculation: ($350,000 / 1,000) * 44.78 = $15,673.00
Motor Vehicle Tax Cap:
It's important to note that the mill rate for motor vehicles in West Hartford is capped by the state and will remain at 32.46 mills.

Reassessment Schedule:
As mentioned, the next town-wide revaluation is scheduled for October 1, 2026. This process will update the fair market values of all properties and subsequently impact their assessed values for future tax years. The town is currently in the process of taking photos of all properties in preparation for this revaluation.
Navigating the West Hartford Real Estate Market
Changes in property taxes and the anticipation of a future revaluation can influence homeowners' decisions about their properties. If you're considering selling your home in West Hartford and want to understand the current market dynamics, including the impact of mill rates and the upcoming reassessment, I'm here to help.

Alex Teplitskiy
REALTOR®
FHE, MBA
CENTURY 21 AllPoints Realty
As a local Realtor, I can provide you with a comprehensive market analysis based on current conditions and help you navigate the potential implications of the upcoming revaluation. Let's connect to discuss your options and make informed decisions in the evolving West Hartford market.

The Squeeze is Real: How Latest CPI & PPI Reads are Tightening the Screws on […]

Florida Greenlights Gold & Silver: Is the U.S. Dollar’s Dominance Being Challenged From Within? (Hold […]

The Hopkins Inn Beyond the Residential Flip: Unlocking the Untapped Potential of Large Connecticut Properties […]

Structuring Investment Properties: Navigating LLC Taxation & Connecticut’s PET Changes Facebook X Linkedin Real estate […]
The Hartford County Housing Hustle: How Fierce is the Fight for Homes?

1st Quarter Trends and the Bigger Picture
Using 2022—the last year of low interest rates and a more balanced market—as our benchmark, let's dive into what Hartford County housing data reveals about the 1st quarter of 2025
| 2022 | 2023 | 2024 | 2025 | |
|---|---|---|---|---|
| JAN | 659 | 573 | 547 | 602 |
| FEB | 761 | 605 | 643 | 575 |
| MAR | 1,078 | 774 | 706 | 827 |
The challenge
A Gap Between Listings and Sales
March 2025 recorded 827 new listings, a strong rebound compared to previous years. However, the number of sales remained consistent at 543, showing no significant growth in absorption. This gap raises the question: are sellers pricing homes beyond what buyers are willing—or able—to pay in this current market?
| 2022 | 2023 | 2024 | 2025 | |
|---|---|---|---|---|
| JAN | 786 | 538 | 542 | 567 |
| FEB | 606 | 464 | 452 | 479 |
| MAR | 768 | 600 | 537 | 543 |

THE DILEMMA
Pricing Disconnect
While median list prices in March 2025 rose 12% year-over-year to $359,000, buyers are negotiating differently. Median sale prices, at $333,250, reflect a 4% increase—a slower pace than the list price growth. The data suggests buyers are pushing back against higher asking prices, leading to a trend where homes sell for 7% below list price.
| 2022 | 2023 | 2024 | 2025 | YoY | |
|---|---|---|---|---|---|
| JAN | $269,900 | $289,900 | $305,000 | $325,000 | 7% |
| FEB | $279,900 | $299,900 | $315,000 | $340,000 | 8% |
| MAR | $279,900 | $314,900 | $319,900 | $359,000 | 12% |
| 2022 | 2023 | 2024 | 2025 | YoY | |
|---|---|---|---|---|---|
| JAN | $260,000 | $280,000 | $309,000 | $337,500 | 9% |
| FEB | $257,000 | $280,000 | $315,000 | $330,000 | 5% |
| MAR | $260,000 | $285,000 | $320,000 | $333,250 | 4% |

Alex Teplitskiy
REALTOR®
FHE, MBA
CENTURY 21 AllPoints Realty
The results
 Market Signals
The ratio of sales to new listings dropped to 0.66 in March, a significant shift from the absorption levels seen in 2022. This trend may indicate a recalibration in market activity—potentially a “glitch” or pivot toward a more balanced market.
| 2022 | 2023 | 2024 | 2025 | |
|---|---|---|---|---|
| JAN | 1.19 | 0.94 | 0.99 | 0.94 |
| FEB | 0.80 | 0.77 | 0.70 | 0.83 |
| MAR | 0.71 | 0.78 | 0.76 | 0.66 |

 Reality Check: This discrepancy between seller expectations and buyer behavior highlights an evolving market. Buyers are showing more restraint, likely influenced by higher mortgage rates and broader economic factors. What once was a market defined by overbidding has shifted into one where negotiations and pricing strategy are crucial.
THE TAKEAWAY
Negotiate Success
While the MLS's March market report for Hartford County highlights an average premium of 4.25% over the asking price, it's worth noting that comparing the median listing price to the median sale price provides a different perspective on the dataset. The median measure focuses on the middle range, offering insight that's less impacted by outliers, such as exceptionally high or low sale prices. This alternative comparison could reveal trends that better reflect the overall market's typical behavior.

Previous years show relative consistency in the first quarter, the data from 2025 reveals a notable shift. January stands out with the median sale price being over the median list price by 4%, marking the strongest seller advantage compared to previous years. In contrast, February and March highlight softer trends, with the median sale price being lower the median list price by 3% and 7%, respectively—suggesting buyers are negotiating more assertively. This break from the pattern suggests changing market dynamics, with buyers and sellers needing to adapt their strategies to the evolving conditions.
The takeaway is clear: negotiation skills are now paramount for navigating these fluctuations, ensuring sellers can maximize returns and buyers can seize opportunities for better deals

Facebook X Linkedin Beyond the Primary Residence: Where the Ultra-Wealthy Are Investing When it comes […]
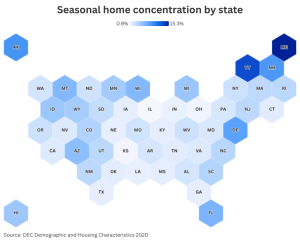
Facebook X Linkedin Where vacation homes dominate: Top US counties with the highest share of […]
CT Real Estate Investors: Will Our Market Follow the National “Buyer’s Market” Trend? Facebook X […]

The AI Paradox: Navigating a Seismic Shift in Commercial and Residential Real Estate Facebook X […]

Navigating the Mortgage Interest Deduction: What Homebuyers Need to Know in 2025 Facebook X Linkedin […]

Summer Scouting for Your Connecticut Shoreline Dream Home: A Strategic Approach Facebook X Linkedin Summer […]
Need help? Book a call at a time to suit your schedule
As we watch this unfold, it’s a pivotal time for both buyers and sellers. Sellers may need to reassess pricing strategies to align with market realities, while buyers have an opportunity to leverage negotiating power.

ALEX TEPLITSKIY
REALTOR®
(860) 543-9417
The Waiting Game: How Many Home Sellers Eventually Lower Their Price?
When selling a house, pricing it correctly from the start can determine how quickly it will sell and at what price. This year’s data on single-family homes sold in Hartford County, Connecticut, sheds light on trends in pricing and price adjustments. Let’s delve into the numbers to uncover actionable insights for homeowners planning to put their properties on the market.
Price Adjustments by Month
The data reveals notable trends in price adjustments, with a steady decline in the percentage of price cuts as the year progresses:

Homes sold in January had the highest rate of price cuts, with nearly 41% requiring adjustments. This suggests that sellers who listed in winter may have set higher initial prices, potentially reflecting the seasonal slowdown in demand. By April, price cuts dropped to 26.88%, hinting at a more competitive and accurate pricing approach in the spring.
Price Cuts by Towns
A breakdown of price cuts by town highlights the areas where sellers were most likely to lower their asking prices:
| Town | # of Price Cuts |
| Bristol | 67 |
| Hartford | 55 |
| Enfield | 43 |
| Manchester | 41 |
| New Britain | 40 |
| East Hartford | 38 |
| Southington | 38 |
| South Windsor | 30 |
| West Hartford | 28 |
| Farmington | 27 |

Price Cuts by Square Footage
The relationship between home sze and price cuts is particularly striking
| Square Footage Range | Total Homes Sold | # of Price Cuts | % of Price Cuts |
| 0–1000 sqft | 266 | 97 | 36.47% |
| 1000–2000 sqft | 1258 | 396 | 31.48% |
| 2000–3000 sqft | 320 | 103 | 32.19% |
| 3000–4000 sqft | 62 | 27 | 43.55% |
| 4000–5000 sqft | 23 | 11 | 47.83% |
| 5000+ sqft | 19 | 16 | 84.21% |


Smaller homes (0–1000 sqft) had a moderate rate of price cuts at 36.47%. Mid-sized homes (1000–2000 sqft), which represent the largest share of sales, had a slightly lower price cut percentage of 31.48%. However, as homes increase in size beyond 3000 sqft, the likelihood of a price cut rises significantly, with 84.21% of homes larger than 5000 sqft needing adjustments. This suggests that larger homes may be more challenging to price accurately, reflecting their niche market appeal.
Key Takeaways for Sellers
Price Strategy by Season: Listing a home in the spring may reduce the likelihood of needing a price cut compared to winter months, when the market is typically slower.
Know Your Local Market: Towns like Bristol and Hartford show higher numbers of price adjustments, emphasizing the importance of understanding local market dynamics before setting a price.
Account for Size: For larger homes, consider pricing more conservatively upfront to avoid significant price reductions later.
By examining these trends, sellers can approach pricing with greater precision, aligning their strategy with market conditions to maximize their chances of a successful sale.
Conclusion
The Hartford County housing market offers valuable insights into pricing patterns for single-family homes. Whether you're planning to sell soon or simply curious about market trends, this data underscores the importance of local knowledge and strategic decision-making. A well-priced home attracts buyers quickly and minimizes the need for price cuts—ensuring a smooth and profitable sale process.

Alex Teplitskiy
REALTOR®
FHE, MBA
CENTURY 21 AllPoints Realty
Facebook X Linkedin Beyond the Primary Residence: Where the Ultra-Wealthy Are Investing When it comes to luxury real estate, the most discerning buyers are not […]
Facebook X Linkedin Where vacation homes dominate: Top US counties with the highest share of seasonal housing For many Americans, owning a second home in […]
CT Real Estate Investors: Will Our Market Follow the National “Buyer’s Market” Trend? Facebook X Linkedin You’ve probably seen the national headlines predicting a widespread […]
The AI Paradox: Navigating a Seismic Shift in Commercial and Residential Real Estate Facebook X Linkedin The corporate world’s relentless pursuit of “lean” operations, largely […]
Navigating the Mortgage Interest Deduction: What Homebuyers Need to Know in 2025 Facebook X Linkedin Buying a home is a major life milestone, and for […]
Summer Scouting for Your Connecticut Shoreline Dream Home: A Strategic Approach Facebook X Linkedin Summer in Connecticut brings out the undeniable allure of the shoreline […]
Alex Teplitskiy
REALTOR®
FHE, MBA
CENTURY 21 AllPoints Realty
Ever wonder what is a typical affordable home in today's makret?

Okay, let's estimate what price house a couple could afford in West Hartford based on both individuals earning the average Connecticut hourly wage of $39.08 (as reported by CT Department of Labor for March 2025).
1. Calculate Combined Gross Annual Incokme
Individual Annual Income: $39.08/hour * 40 hours/week * 52 weeks/year = $81,286.40
Combined Gross Annual Income: $81,286.40 * 2 = $162,572.80
2. Estimate Combined Gross Monthly Income:
Combined Gross Monthly Income: $162,572.80 / 12 months = $13,547.73
3. Apply the 28/36 Rule (as a guideline):
28% Rule (Housing Costs): 28% of $13,547.73 = $3,793.37 (This is the estimated maximum they should spend on principal, interest, property taxes, and homeowners insurance - PITI).
36% Rule (Total Debt): 36% of $13,547.73 = $4,877.18 (This is the estimated maximum for all monthly debt, including the mortgage, car loans, student loans, credit card minimums, etc.).
4. Estimate Affordable House Price (This requires assumptions about interest rates, property taxes, and insurance in West Hartford):
Let's make the following rough assumptions for a 30-year fixed-rate mortgage:
Interest Rate: 7% (as of April 17, 2025 - this can fluctuate)
Property Taxes in West Hartford: Approximately 1.7% of the home's value annually (this varies by specific location and mill rate).
Homeowners Insurance: Approximately $1,800 per year ($150 per month).
No significant other debt and a 20% down payment.
Now, we need to work backward from the estimated maximum PITI to get a potential home price. This is best done using a mortgage calculator, but we can illustrate the concept:
If their maximum PITI is around $3,793.37, we need to subtract the estimated property taxes and insurance to get an approximate principal and interest (PI) payment.
Let's assume a home price of $550,000 for this illustration:
Estimated Annual Property Taxes: $550,000 * 0.017 = $9,350 ($779.17 per month)
Homeowners Insurance: $150 per month
Total Taxes & Insurance: $779.17 + $150 = $929.17 per month
Maximum Principal & Interest Payment: $3,793.37 - $929.17 = $2,864.20
Using a mortgage calculator with a loan amount of $440,000 (80% of $550,000), a 7% interest rate, and a 30-year term, the principal and interest payment would be roughly $2,929.
Therefore, with these assumptions, a two-earner couple in West Hartford making the average hourly wage might be able to afford a home in the range of roughly $500,000 to $600,000.
Important Considerations
Down Payment: A larger down payment would reduce the loan amount and monthly payments, making a more expensive home potentially affordable.
Other Debt: Significant car loans, student loans, or credit card debt would reduce the amount they can afford for a mortgage.
Credit Score: Excellent credit could secure a lower interest rate, increasing affordability.
Job Security and Stability: Lenders will also consider the stability of their employment.
Future Expenses: They should also consider future expenses like potential childcare, increased living costs, etc.
Recommendation
The best way for this couple to determine their affordable home price is to:
Get pre-approved for a mortgage: This will give them a realistic idea of how much a lender is willing to lend them based on their specific financial situation.
Use online mortgage affordability calculators: Inputting their combined income, debts, and estimated down payment will provide a more personalized estimate.
Speak with a local real estate agent (like yourself!): You can provide valuable insights into the West Hartford market, typical costs, and connect them with local lenders.
Keep in mind that the $500,000 - $600,000 range is a rough estimate based on several assumptions. Actual affordability could be higher or lower depending on their individual circumstances.
Job Security and Stability: Lenders will also consider the stability of their employment.
Future Expenses: They should also consider future expenses like potential childcare, increased living costs, etc.
Facebook X Linkedin Beyond the Primary Residence: Where the Ultra-Wealthy Are Investing When it comes to luxury real estate, the most discerning buyers are not […]
Facebook X Linkedin Where vacation homes dominate: Top US counties with the highest share of seasonal housing For many Americans, owning a second home in […]
CT Real Estate Investors: Will Our Market Follow the National “Buyer’s Market” Trend? Facebook X Linkedin You’ve probably seen the national headlines predicting a widespread […]
The AI Paradox: Navigating a Seismic Shift in Commercial and Residential Real Estate Facebook X Linkedin The corporate world’s relentless pursuit of “lean” operations, largely […]
Navigating the Mortgage Interest Deduction: What Homebuyers Need to Know in 2025 Facebook X Linkedin Buying a home is a major life milestone, and for […]
Summer Scouting for Your Connecticut Shoreline Dream Home: A Strategic Approach Facebook X Linkedin Summer in Connecticut brings out the undeniable allure of the shoreline […]

ALEX TEPLITSKIY
REALTOR®
(860) 543-9417
alex.teplitskiy@gmail.com
Licensed in Connecticut

Alex Teplitskiy
Real Estate Salesperson
FHE
CENTURY 21 AllPoints Realty
Navigating the Greater Hartford Real Estate Market: A Guide for Buyers & Sellers
The Greater Hartford real estate market continues to evolve, offering opportunities for both home buyers and sellers as we move into spring. Recent data from the Greater Hartford Association of REALTORS® (GHAR) shows notable trends that could shape your real estate decisions. Here’s what you need to know.
For Sellers: Pricing Power & Market Timing
The median sales price for single-family homes in Greater Hartford has risen 5.6% compared to last year, now reaching $396,250. This upward trend, coupled with decreased days on the market (26 days on average), signals a strong seller’s market.
However, it’s essential to price your home competitively. While homes are selling faster, buyers remain cautious, and properties priced too aggressively may linger longer than expected. Ensuring your home is well-prepared, staged, and marketed effectively can maximize your returns.
The increase in inventory—up 2.9%—is a positive indicator for sellers looking to capitalize on eager buyers entering the market. More buyers means more competition, but it’s key to work with an experienced Realtor to navigate negotiations wisely.
For Buyers: More Choices, But Act Fast
Potential buyers may find relief in the fact that inventory is increasing. New listings are up 15.6% compared to last year, offering more options to choose from. This could provide slightly better opportunities, but with demand still high, homes continue to sell quickly.
The average days on market have dropped 10.3% for single-family homes, meaning buyers must act fast when they find the right property. Mortgage rates remain steady, and with increased inventory, now is the time to engage with a Realtor who understands market trends and can help you navigate competitive offers.
Condos also offer strong investment potential, with median sales prices rising 18% to $295,000. Closed condo sales have increased 19%, reinforcing the growing appeal of condominiums in the Greater Hartford market.
Market Outlook: A Season of Opportunity
With inventory on the rise, both buyers and sellers are in a better position this spring. If you’re selling, pricing and presentation will be key to maximizing your home’s value. If you’re buying, expect competition, but know that increased listings may provide more options.
Nationally, pent-up demand is being released, according to Lawrence Yun, Chief Economist of the National Association of REALTORS®. Buyers are slowly entering the market, and steady mortgage rates should continue to support purchasing activity.
Final Thoughts
Whether you’re thinking of buying or selling, now is the time to plan strategically. Connect with a trusted Realtor to navigate the market and position yourself for success in this evolving real estate landscape.
Alec and Hilaria Baldwin have opened the doors to their stunning $11 million Hamptons mansion, and it’s a masterpiece of luxury living. With sprawling grounds, breathtaking interiors, and exceptional amenities, this home is an ideal retreat for their large family of nine. It’s not just a home; it’s a lifestyle.
This incredible property offers more than 10,000 square feet of heated living space, a resort-style pool, and all the hallmarks of modern luxury. But what can we, as homeowners and buyers, take away from such a high-profile property? Let’s break it down.
Luxury Isn’t Just About Size
While the Baldwins’ home is massive, the true value lies in its unique features: thoughtfully designed outdoor spaces, timeless architectural details, and an unparalleled level of privacy. In Connecticut, I see similar trends where buyers value character-rich homes in premier locations that blend elegance with functionality.
The Importance of Location
The Hamptons is synonymous with exclusivity, and the prestige of living there is a major driver of its real estate prices. For Connecticut homeowners, towns like Greenwich or Westport offer similar prestige with proximity to New York City, making them highly desirable spots for those seeking a blend of luxury and convenience.
Connecticut’s Luxury Market
We’ve seen a fascinating year so far for Connecticut’s luxury real estate market. While each county tells its own story, homes that offer a distinctive charm and premium amenities tend to see the most interest. on how luxury homes performed in January and February 2025 to see how these trends are playing out across the state.
The Takeaway for Homeowners
Whether you’re dreaming of a Hamptons-style retreat or planning to sell your own luxury home, the key is understanding your market. Knowing what buyers are looking for—whether it’s location, space, or modern conveniences—is crucial to making informed decisions. That’s where I come in! Let’s discuss how your property fits into these trends and create a strategy tailored to your goals.
📌 For more on Alec and Hilaria Baldwin’s Hamptons home, read the full article on .
📞 Alex Teplitskiy Realtor® 📧 (860) 543-9417 | alex.telitskiy@gmail.com 🏢 Century21 AllPoints Realty
Welcome to my latest analysis of the Connecticut real estate market! Today, we’re diving into the most active markets across various home size ranges for single-family houses sold in January and February 2025.
Small Homes (< 2000 SQFT):
- Fairfield County: Median price increased by 6.70% ($470,000 to $501,500) over 133 sales in February, showing a strong demand for smaller homes in this area.
- Hartford County: Slight increase by 0.62% ($323,000 to $325,000) across 270 sales, reflecting a stable market.
- New Haven County: Strong growth with an 11.56% increase ($320,000 to $357,000) over 249 sales, indicating rising interest in smaller homes.
- New London County: Rise by 6.62% ($325,000 to $346,500) with 106 sales, suggesting healthy market activity.
Mid-Sized Homes (2000-3000 SQFT):
- Fairfield County: Median price decreased by 16.76% ($865,000 to $719,995) with 39 sales, which may indicate a cooling off in this segment.
- Hartford County: Decrease by 3.23% ($495,000 to $479,000) over 38 sales, showing slight price adjustments.
- Middlesex County: Significant surge by 52.85% ($460,000 to $703,104) with 8 sales, highlighting a strong upward trend.
- New London County: Stable median price of $525,000 across 17 sales, reflecting consistent demand.
- Windham County: Increase by 18.75% ($400,000 to $475,000) with 9 sales, indicating a favorable market.
Luxury Homes (>= 3000 SQFT):
- Fairfield County:
- 3000-3500 SQFT: Slight decrease by 0.62% ($1,200,000 to $1,192,500) over 30 sales.
- >= 4000 SQFT: Decrease by 4.15% ($2,410,000 to $2,310,000) with 41 sales, showing some variability in the luxury market.
- Hartford County:
- 3000-3500 SQFT: Notable increase by 12.65% ($612,500 to $690,000) with 6 sales, reflecting a positive trend.
- >= 4000 SQFT: Decrease by 12.49% ($1,025,000 to $896,975) over 12 sales, indicating a correction in prices.
- New Haven County:
- 3000-3500 SQFT: Increase by 9.66% ($647,450 to $710,000) across 13 sales, showcasing a strong market.
- >= 4000 SQFT: Decrease by 14.10% ($1,277,652 to $1,097,500) with 6 sales, suggesting some market adjustments.
- New London County:
- 3000-3500 SQFT: Increase by 4.68% ($790,000 to $827,000) with 7 sales, reflecting consistent demand.
- >= 4000 SQFT: Increase by 22.33% ($1,030,000 to $1,260,000), but only 1 sale in February, showing high value for luxury homes.
Market Summary
These figures highlight the most active markets for various home sizes, providing valuable insights into current trends. It’s important to consider the number of sales in each category, as fewer transactions can lead to higher variability in median prices.
📌 Download the Full Report: CT Median Closed Prices by Home Sizes January February Comparison
Let’s Connect!
Planning to buy, sell, or invest in the Connecticut real estate market? Let’s discuss these trends and understand how they can impact your decisions. I’m here to provide expert advice and personalized insights to help you navigate the market with confidence.
📞 Alex Teplitskiy Realtor® 📧 (860) 543-9417 | alex.telitskiy@gmail.com 🏢 Century21 AllPoints Realty
#ConnecticutRealEstate #MarketTrends #HomeSales #RealEstateInvesting #RealtorLife #MarketAnalysis
 A home equity loan can make buying a second property less expensive and give more liquidity to the buyer. When using home equity specifically to buy an investment property, there are a few distinct advantages.
You Could Increase Your Down Payment
Home equity loans are received in a lump sum payment, giving you more cash to use toward your next property. By choosing to put more of that money toward your down payment, you can potentially lower your monthly payments and interest rates.
You Could Solve Financing Challenges
Second properties are typically more difficult to finance due to stricter down payment requirements, making a home equity loan a more convenient and affordable solution for most borrowers.
Interest Rates Will Likely Be Lower
Lenders spend less time originating home equity loans, which may save you money, as it typically means lower fees and closing costs. But perhaps the biggest advantage of this option is the potential to lower your interest rates.
Home equity loans offer lower interest rates because they are secured by collateral in the form of real estate. This means by utilizing a home equity loan, you can avoid the hefty interest rates you would encounter through other forms of financing, like hard money and personal loans.
Disadvantages Of Using Home Equity To Buy An Investment Property
Despite the benefits of using home equity to buy an investment property, there are also some potential risks.
You Are Trading Assets In For Debt
Getting a home equity loan means turning assets into debt because you are effectively taking the part of your home that you own and tying it up in another loan. Although this may be worth it in some scenarios as it prevents you from having to withdraw money from existing investments, there are also implications to having higher debt that you must consider.
You Are Leaving Yourself Vulnerable To Shifts In The Housing Market
All homeowners are technically vulnerable to these shifts, but by owning two properties, you are essentially doubling your potential risk to changes in the housing market. If either home’s value lessens, you may end up owing more on your mortgage and home equity loans, which can spread some homeowners too thin.
And if you default on the loan, you could potentially lose both your primary and secondary properties, as both are held as collateral. You should also note that reduced market values could affect your ability to resell the investment property.
You Could Have Three Mortgages For Only Two Homes
A home equity loan is often taken out in the form of a second mortgage. Combine this with the financing you will need for your second home, and it’s likely you will end up with three mortgages for only two properties.
Although this is important to remember, it’s not necessarily a deal breaker, as it’s no worse than having two mortgages and another loan – which would likely have higher interest rates.
Your Home Equity Loan Interest Payments Will Likely Not Be Tax-Deductible
In 2018, changes to tax codes led to somewhat ambiguous guidelines for investment properties. Because of this, we recommend consulting with an accountant before making any decisions. However, if the home equity loan is not specifically being used to improve the property it was taken out against, it’s likely it will not be tax deductible.
The Bottom Line: Using Home Equity To Buy A Second House Comes With Risks, But It’s A Solid Option
Can you use home equity to buy a second home or an investment property? The answer is yes – and there are some significant benefits to doing so. But as with anytime you take on debt, there are also some potential risks. To ensure your financial success, I recommend analyzing all of the pros and cons before taking action.


© 2026 MoxiWorks
© CENTURY 21 2023 - 2024. All rights reserved. CENTURY 21®, C21® and the CENTURY 21 Logo are registered service marks owned by Century 21 Real Estate LLC. Franchisee Legal Entity Name (not the dba) fully supports the principles of the Fair Housing Act and the Equal Opportunity Act. Each franchise is independently owned and operated. Any services or products provided by independently owned and operated franchisees are not provided by, affiliated with, or related to Century 21 Real Estate LLC nor any of its affiliated companies.
