

The Pulse of Hartford County Buyers in April 2025


Key Observations for April 2025:
Number of Sales: There were 602 single-family home sales in Hartford County. This represents a decrease of 5.8% compared to April 2024.
Median Sale Price: The median sale price was $370,000, showing a significant increase of 11.8% from the previous year.
Percentage Over or Under Asking Price: On average, homes sold for 5.3% above the original asking price. This is a slight decrease of 1.0% compared to April 2024.

Key Market Dynamics: Fewer Sales, Higher Prices Amidst Shifting Inventory
The April 2025 data for Hartford County reveals a nuanced picture of buyer demand. While the number of new listings (supply) saw a slight decrease of 5.7% compared to last year, the number of new pendings (demand) experienced a more significant drop of 26.5%. This decrease in pending sales, coupled with the earlier observation of fewer overall sales but a notably higher median price, suggests a market where buyer activity, in terms of initiating new contracts, has cooled somewhat. However, the elevated median sale price indicates that the homes currently selling are still commanding strong values. To truly understand the dynamics at play and the specific segments where buyer demand remains robust, it's essential to analyze what types of properties are successfully moving in this evolving market. Let's delve deeper into the sales data by price range to pinpoint where buyer interest is concentrated and where opportunities might lie for both buyers and sellers.
Where the Buyers Are: Sales Volume by Price Point in Hartford County

Highest Demand: The $200k - $399k price range saw the most sales (298), indicating strong buyer activity in this segment.
Significant Interest: The $400k - $599k range also experienced a substantial number of sales (154).
Price & Size Correlation: Generally, average square footage increases with the price range.
Sweet Spot Consideration: Sellers with homes in the average square footage of the high-demand price ranges may find a larger pool of interested buyers.
Luxury Market: Fewer sales occur at higher price points ($800k+), but these homes offer significantly more square footage.
Strategic Pricing: Aligning Your Hartford County Home with Buyer Demand (by Sqft)
Understanding where the strongest buyer demand lies in Hartford County, as clearly illustrated by the sales volume in the $200k - $399k and $400k - $599k price ranges, is crucial for sellers. If your home's square footage aligns with the average seen in these active brackets (around 1,417 sqft and 2,072 sqft respectively), strategic pricing within these ranges can attract a larger pool of motivated buyers.
Conversely, sellers of larger homes need to be mindful of the potentially smaller buyer pool in higher price tiers. While your square footage might be greater, overpricing significantly beyond the typical range for active segments could lead to longer days on market.
For example, if you have a home with around 1,500 sqft, pricing it competitively within the $200k - $399k range, based on its condition and features, is likely to generate more interest than pushing it into the $400k+ range solely based on size, potentially missing the most active buyer segment.
Ultimately, a balanced approach that considers both your home's size and the prevailing buyer demand within specific price ranges in Hartford County will lead to a more effective pricing strategy and a potentially quicker sale.
Insights on Days on Market

The Median Days on Market (DOM) across different price ranges in Hartford County provides further valuable insights into buyer urgency and market heat.
Notice that the $400k - $599k range has one of the lowest median DOM at just 7 days. This reinforces the strong and efficient buyer demand we saw in the sales volume data. Homes priced competitively in this range are moving very quickly.
Interestingly, the $1.4M - $1.99M range shows a significantly higher median DOM of 12 days, despite a moderate number of sales. This could indicate a more discerning buyer pool at this price point, or perhaps a need for more precise pricing.
The lower price ranges (below $400k) also show relatively quick movement, suggesting strong interest from first-time buyers or those seeking more affordable options
Sellers should pay close attention to the DOM trends in their specific price range. A higher DOM might signal a need to re-evaluate pricing or property condition to align with buyer expectations.
General Connecticut Example:
Let's consider a typical single-family home or condo in Connecticut with approximately 1,912 sqft (a size that falls within the average range observed in the more active price points). Based on the Hartford County data, homes in the $200k - $599k range, where we see the highest sales volume, have an average square footage between roughly 1,400 and 2,100 sqft.
Therefore, if you have a 1,912 sqft property, your initial pricing strategy should heavily consider the sweet spots of buyer demand in these price brackets. Overpricing it significantly above $600k might place it in a segment with fewer buyers and potentially longer days on market, even though the size might seem to warrant a higher price.
To attract the most interest, a careful analysis of recent comparable sales of similar-sized properties within the $200k - $599k range in your specific location is crucial. Factors like condition, features, and exact location will then fine-tune the optimal listing price to meet buyer expectations and tap into the strongest demand.
Average % Closed Over or Under Asking Price

As you consider pricing, this chart illustrates the average percentage homes are selling above or below their asking price across different price ranges in Hartford County. Notice that the $400k - $599k range, which we identified as a high-demand segment, also sees homes selling for an average of 7.24% above asking. This indicates strong buyer competition and suggests that well-priced homes in this range have the potential to sell quickly and above list price. Conversely, the lower price range (0 - $199k) sees homes selling slightly below asking on average, which could inform pricing strategies for properties in that segment.
Transitioning to Local Expertise: The Unique Dynamics of West Hartford:
While the previous example provides a general framework for pricing in Connecticut, the real estate landscape can vary significantly from town to town. To illustrate this, let's focus specifically on West Hartford, a market with its own distinct characteristics and buyer preferences.
| Price | # of Sales | Ave Sqft | Median DOM | Average % Closed Over or Under Asking |
|---|---|---|---|---|
| $200k-$399k | 10 | 1,379 | 11 | -0.13% |
| $400k-$599k | 13 | 2,069 | 6 | 10.20% |
| $600k-$799k | 10 | 2,719 | 5 | 12.34% |
| $800k-$999k | 4 | 2,954 | 5 | 10.85% |
| $1M-$1.19M | 3 | 3,624 | 6 | 11.13% |
| $1.4M-$1.99M | 2 | 6,051 | 4 | 10.00% |
This detailed breakdown clearly illustrates the varying levels of demand, speed of sale, and pricing dynamics within different segments of the West Hartford market. For instance, the strong "above asking" percentages in the higher price ranges, coupled with quick DOM, highlight the competitive nature of these segments in West Hartford, while the lower price range shows a different trend.
The Importance of Local Expertise
As we've seen, the Hartford County real estate market, and even specific towns within it like West Hartford, exhibit unique characteristics. The data clearly demonstrates that pricing a home effectively requires a nuanced understanding of these local dynamics. This is where the expertise of a knowledgeable Realtor becomes invaluable.
Pricing a Home in Today's West Hartford Market: A Practical Example
Let's consider a 2,423 sqft home in West Hartford, which is the average size of homes currently being sold in the town. Here's how I, as a West Hartford real estate expert, would approach pricing this property: I'd first look at the 'West Hartford Market Data Table' to see that the average square footage of homes sold in the $600k-$799k range is around 2,719 sqft. This tells me that there's buyer activity in this range for homes of this size.
However, I wouldn't price it at the very top of that range without further analysis. I'd then conduct a detailed comparative market analysis (CMA), examining recent sales of similar-sized homes in the same neighborhood, taking into account the home's specific condition, features (like a renovated kitchen or a large backyard), and its precise location within West Hartford. This ensures the home is priced competitively to attract the most qualified buyers while maximizing the seller's return.
In Conclusion: Navigating Hartford County's Dynamic Market
The April 2025 data for Hartford County reveals a market with both opportunities and complexities. While overall sales have seen a slight decrease, strong pricing power persists, driven by buyer demand that varies across price points and, crucially, from town to town. As we've seen, even within Hartford County, a town like West Hartford exhibits its own unique dynamics, with specific price ranges attracting different buyer segments and showing varying levels of competition.
For sellers, this means that strategic pricing, informed by a deep understanding of local market nuances, is paramount. Overpricing can lead to missed opportunities, while a well-informed strategy, tailored to the specific characteristics of your property and its location, can maximize your return.
For buyers, this data underscores the importance of being prepared and working with a knowledgeable agent who can provide hyper-local insights. The market remains competitive, and understanding the subtle differences between towns and neighborhoods is essential for making informed decisions and securing the right home.
Whether you're a buyer or seller in Hartford County, particularly in the West Hartford area, I am here to provide you with the expertise and personalized guidance you need to navigate this dynamic market successfully. My in-depth knowledge of local trends, pricing dynamics, and buyer behavior will ensure that you're positioned for success. Contact me today to discuss your real estate goals and how I can help you achieve them.


Facebook X Linkedin Beyond the Primary Residence: Where the Ultra-Wealthy Are Investing When it comes to luxury real estate, the most discerning buyers are not […]
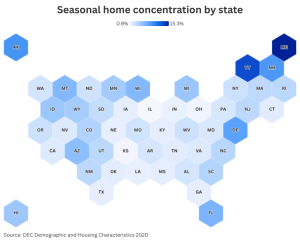
Facebook X Linkedin Where vacation homes dominate: Top US counties with the highest share of seasonal housing For many Americans, owning a second home in […]
CT Real Estate Investors: Will Our Market Follow the National “Buyer’s Market” Trend? Facebook X Linkedin You’ve probably seen the national headlines predicting a widespread […]

The AI Paradox: Navigating a Seismic Shift in Commercial and Residential Real Estate Facebook X Linkedin The corporate world’s relentless pursuit of “lean” operations, largely […]

Navigating the Mortgage Interest Deduction: What Homebuyers Need to Know in 2025 Facebook X Linkedin Buying a home is a major life milestone, and for […]

Summer Scouting for Your Connecticut Shoreline Dream Home: A Strategic Approach Facebook X Linkedin Summer in Connecticut brings out the undeniable allure of the shoreline […]

Connecticut’s Pulse: What Demographic and Economic Trends Mean for Real Estate in 2025 Facebook X Linkedin Connecticut’s real estate landscape is a dynamic interplay of […]

Don’t Toss Your Agent Just Yet: Opendoor’s Settlement Underscores the Enduring Value of Human Expertise in Real Estate Facebook X Linkedin WEST HARTFORD, CT – […]

The Squeeze is Real: How Latest CPI & PPI Reads are Tightening the Screws on the Housing Market Facebook X Linkedin The economic headlines have […]

Florida Greenlights Gold & Silver: Is the U.S. Dollar’s Dominance Being Challenged From Within? (Hold My Fiat, Says Florida!) Facebook X Linkedin Picture this: You’re […]


© 2026 MoxiWorks
© CENTURY 21 2023 - 2024. All rights reserved. CENTURY 21®, C21® and the CENTURY 21 Logo are registered service marks owned by Century 21 Real Estate LLC. Franchisee Legal Entity Name (not the dba) fully supports the principles of the Fair Housing Act and the Equal Opportunity Act. Each franchise is independently owned and operated. Any services or products provided by independently owned and operated franchisees are not provided by, affiliated with, or related to Century 21 Real Estate LLC nor any of its affiliated companies.
